Predictors of COVID vaccination uptake in the U.S.

The coronavirus disease 2019 (COVID-19) pandemic has taken a terrible toll on human life and health due to its rapid and extensive spread and the unpredictability of its clinical features. As a result of high funding and technical support, several safe and effective vaccines were developed within a year after the outbreak. However, changing vaccine trajectories pose a challenge to the goal of achieving herd immunity, defined as 70% immunity, as well as to planning vaccine distribution campaigns.
A recent preprint research paper posted to the medRxiv* server describes the changing patterns of vaccine uptake in the USA and offers short-term forecasts to help create strategies of vaccine supply as required.

Background
Earlier surveys were primarily designed to predict vaccine uptake, before the vaccine was widely available. More recently, population-based studies have shown that younger people from poorer, non-White minority backgrounds and with lower education are more hesitant to take the vaccine.
The greater the level of mistrust in authorities, both in health and in government, and the more the trust in information obtained by certain social media, the less likely the individual was to get vaccinated, especially if the perceived level of risk was low.
Political views have also been shown to play a prominent part in vaccine acceptance because of their role in vaccine misinformation. In fact, political affiliations have a greater impact than ethnicity. However, approximately half of Americans who have received at least one dose have not been covered by demographic surveys so far.
Study aims
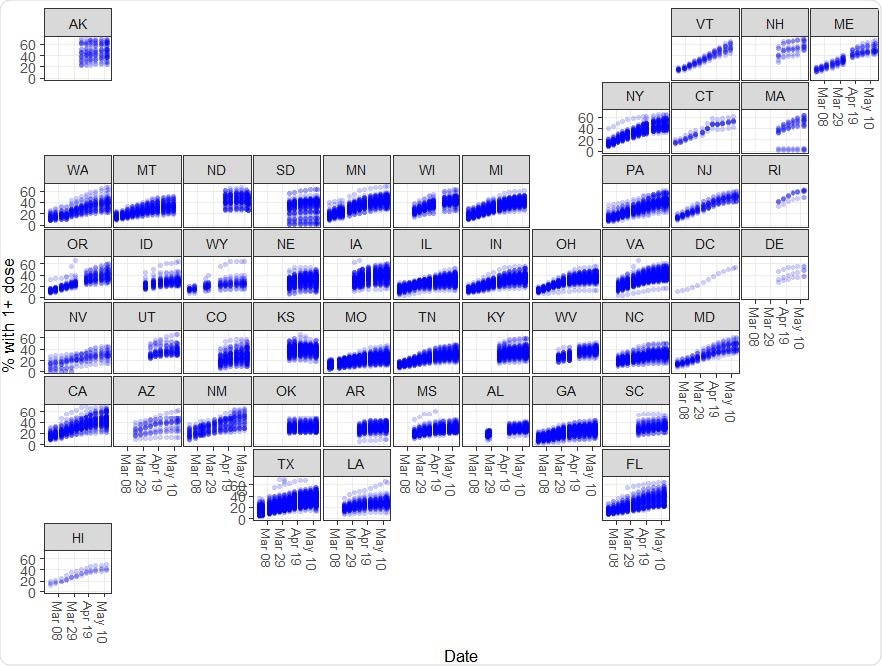
The current study focuses on disparities in vaccination rates among US counties, based on geographic variations and differences in uptake over time – vaccination trajectories.
The geographic disparities are classified as expected and latent, the first being due to social, demographic and COVID-19 risk factors. The latent group includes factors that evade observation, such as political affiliation and levels of trust in authorities.
Using vaccination trajectory estimates, the study predicts the point at which vaccination rates are expected to reach 70%, the herd immunity threshold. The predictive model is reasonably accurate for up to eight weeks ahead, making it useful for tuning vaccine distribution within states.
Correlations were strongest between those below 18 or over 65 years of age, and those educated to high school graduation.
Sociodemographic correlates
Higher vaccination rates were linked to older communities with at least a college education. Older and more educated people had a higher uptake, as expected, both because older people were a priority for the first rollout, and because the online registration system discriminates against the poor and uneducated.
However, communities with large Hispanic and Native American representation also show high vaccine uptake, perhaps because of targeted health outreach efforts, and the higher risk of sickness and death among these groups. The obvious risk posed by the virus to these groups may have led to their being more ready to accept the vaccine than suggested earlier.
Communities with more significant numbers of children, and less education, were more resistant overall.
Disease-linked correlates
Vaccination trajectories were upward in counties where the caseload was high. The correlation between high incidence rates and infection rates and increased vaccine intake is probably because people are more aware of the risk.
In those counties with high rates of positive tests, vaccine uptake tended to be lower. The negative relationship with test positivity may signal the difficulty of getting tested, or late testing trends, or even that people consider themselves to be immune as a result of natural infection.
Disparate performances among counties
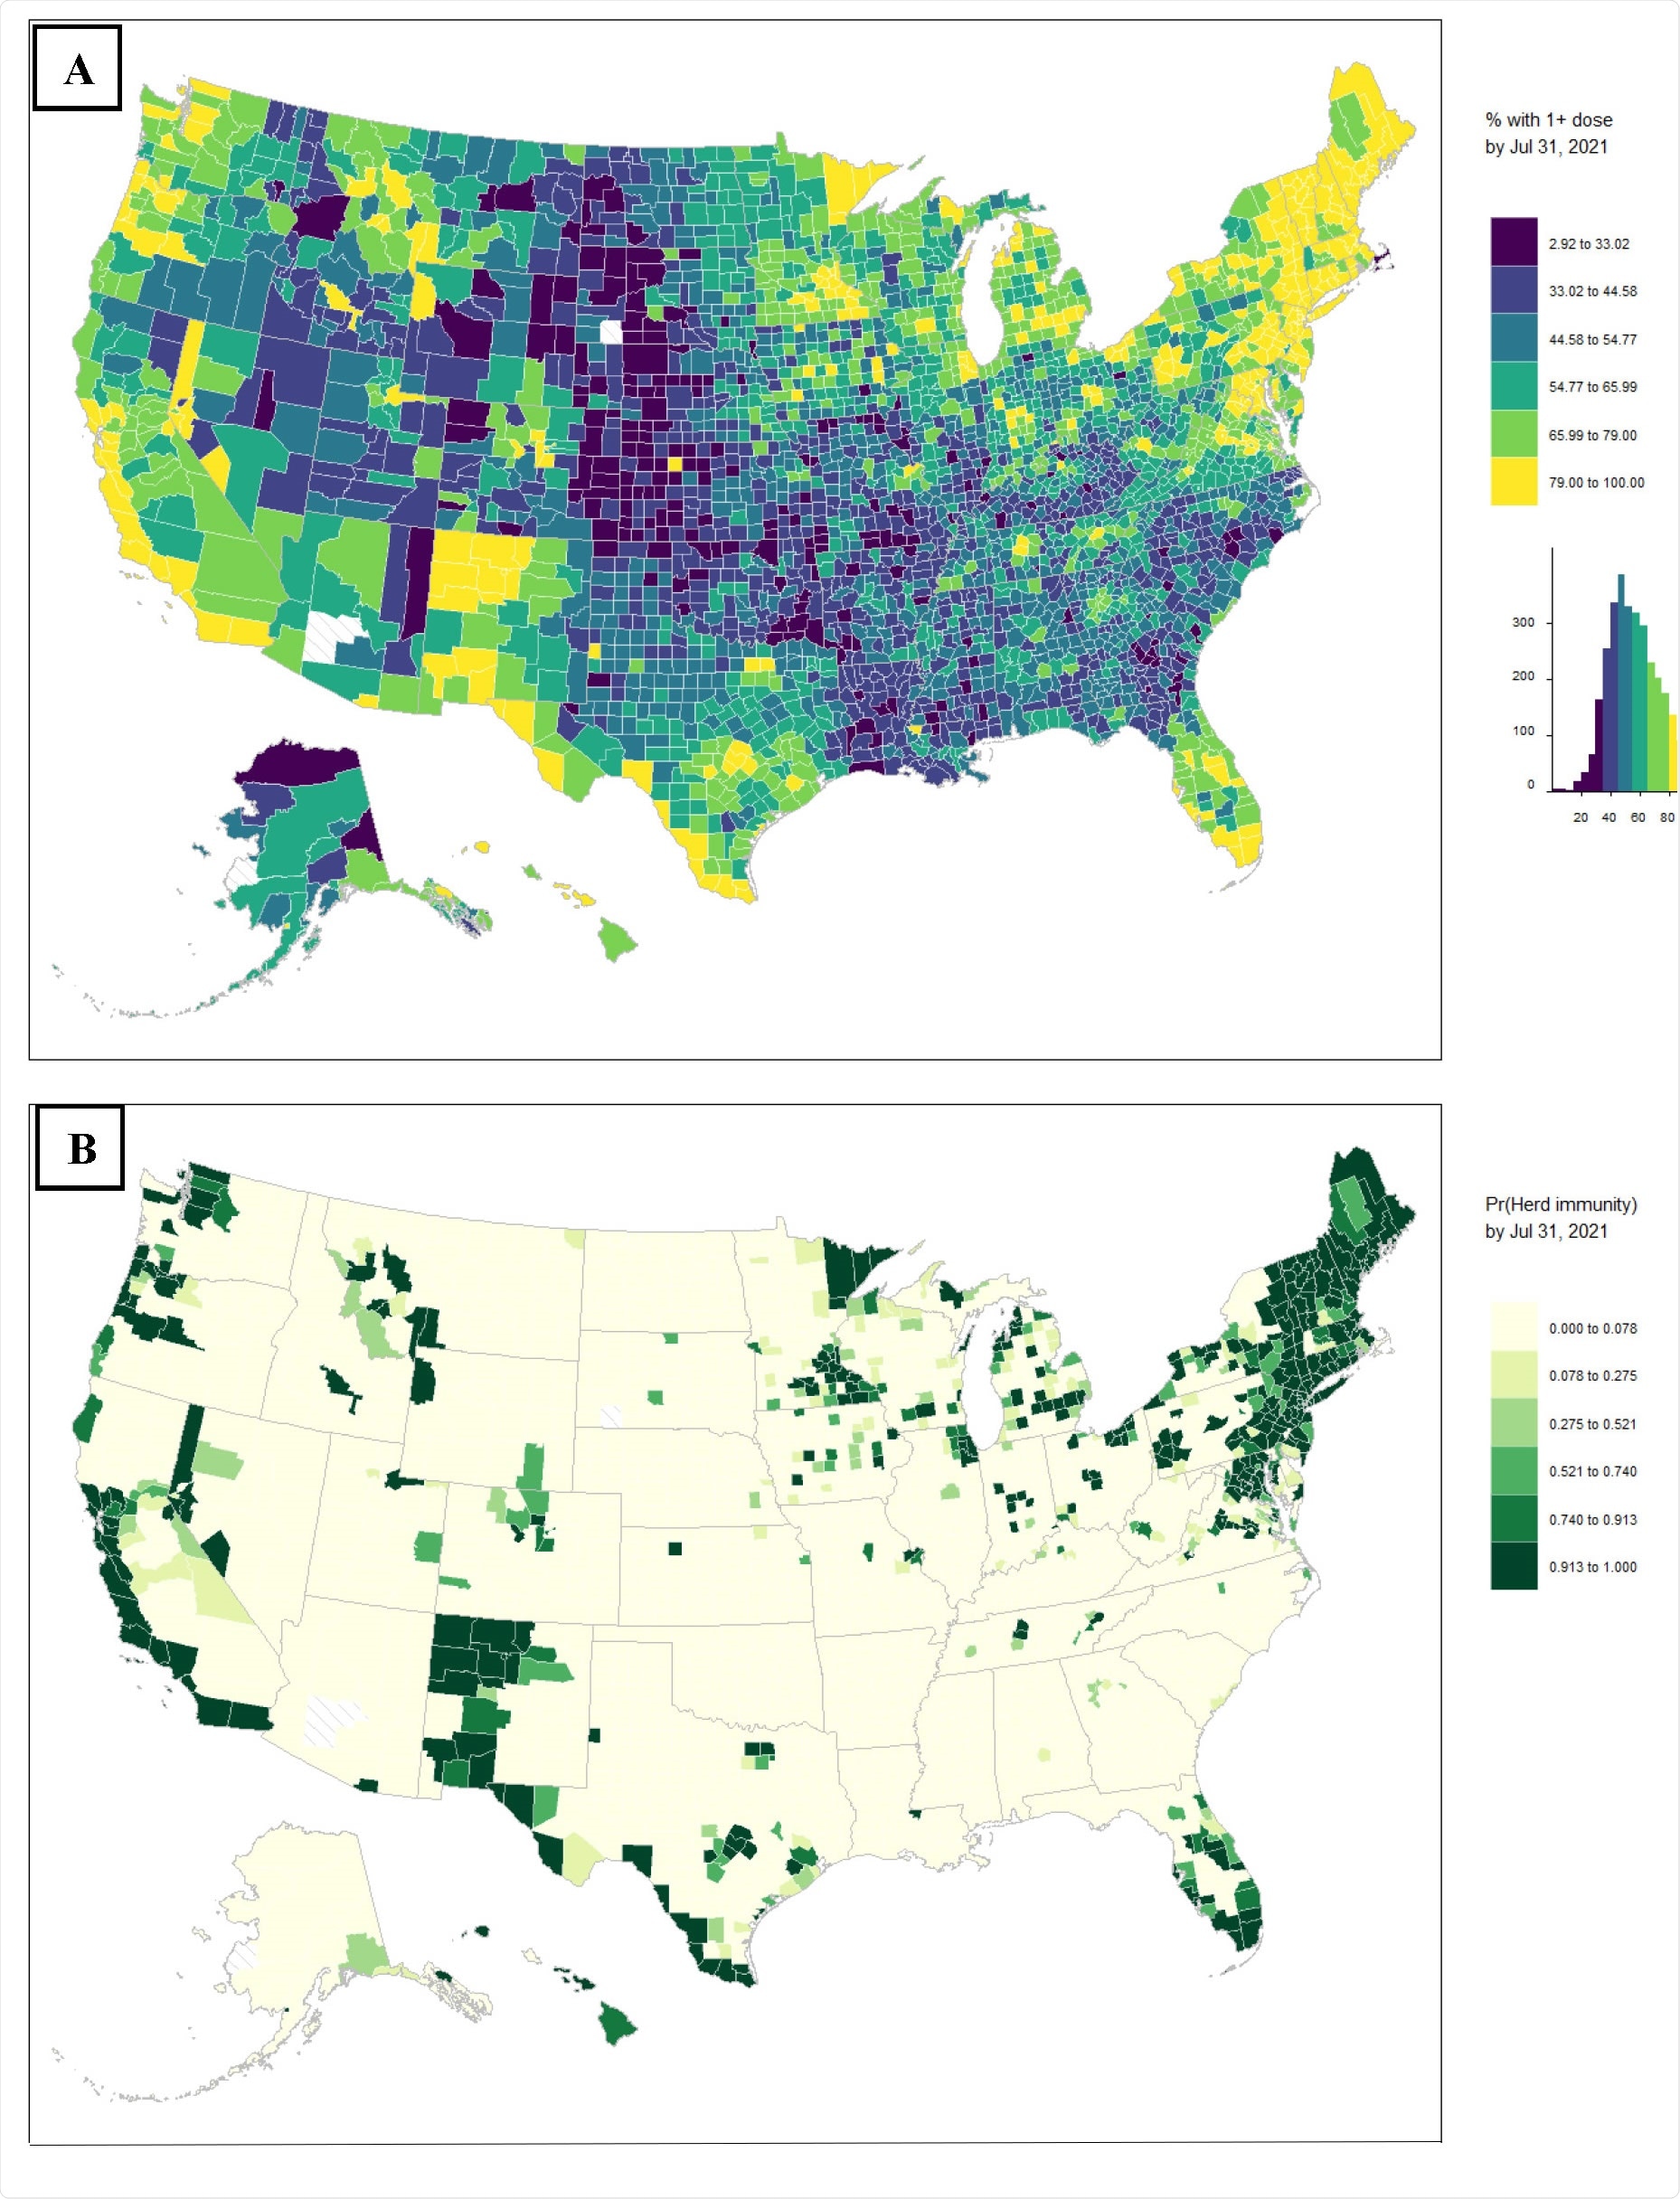
Latent effects were revealed in counties located in New England, the Middle Atlantic seaboard, and East-North Central US, which showed vaccine trajectories in keeping with or above their known characteristics.
Other counties in the South showed lower performance than expected, while a mixed performance was observed from Western US counties. Some strong gradients were seen in Nebraska and in North and South Dakota, decreasing in performance from the east to the west.
Most of the ten counties with high performances have low populations. Some, as in Alaska, have numerous challenges related to transportation, minority status, housing and language. One community, in Virginia, and one, in New Hampshire, had minority and language challenges, vs disability, housing and transportation challenges, respectively.
Vaccination trajectories were typically better in many Middle Atlantic, Pacific and most counties in Michigan, Minnesota, Florida and New Mexico. This was also the case with many highly populated metropolitan counties such as Atlanta, Nashville, Chicago, and Dallas, compared to the surrounding counties.
Herd immunity predictions
For counties in the top quartile, herd immunity is predicted to be achieved by June 25-31. Those in the top 10% would reach it two weeks earlier.
Those with medium trajectories would reach this point by August 8-14, while those at the bottom will only achieve 40% immunity by then. If this is the case, such counties will reach the 70% mark only in the last week of 2021. In fact, those in the lowest 10% will be expected to achieve herd immunity only in January 2022.
These predictions are estimated to be 96% accurate for one week in advance, but 90% for four weeks ahead. At 16 weeks in advance, the predictive error is 16%, making it relatively inaccurate.
What are the implications?
As expected, metropolitan areas show the most favorable vaccine uptake trends, with high levels of disparity when compared to the surrounding areas. Latent factors affect vaccine uptake performance, and contribute to an increasing distance between the top-performing and lowest-performing counties.
While the former may achieve 70% immunity by the end of July 2021, the latter may take until the beginning of the next year to match this.
The median trajectories are found in only some counties, in some parts of the country. These counties may achieve population immunity by fall 2021, allowing schools to reopen. However, the fact that these counties are not widespread, but localized to some areas, makes it more likely that schools will continue to be closed across much of the country.
“Our ability to score each county as over-or under-performing their known characteristics can inform vaccine redistribution efforts within- and between states.”
These models were able to forecast accurately up to four weeks ahead, which will help in these efforts, as well as reopening strategies. Weekly predictions will be available on their website (https://github.com/pchernya/Covid_Vaccine_US).
*Important Notice
medRxiv publishes preliminary scientific reports that are not peer-reviewed and, therefore, should not be regarded as conclusive, guide clinical practice/health-related behavior, or treated as established information.
- Chernyavskiy, P. et al. (2021). COVID-19 vaccine uptake in United States counties: geospatial vaccination patterns and trajectories towards herd immunity. medRxiv preprint. doi: https://doi.org/10.1101/2021.05.28.21257946, https://www.medrxiv.org/content/10.1101/2021.05.28.21257946v1
Posted in: Child Health News | Men's Health News | Medical Research News | Women's Health News | Disease/Infection News
Tags: Children, Coronavirus, Coronavirus Disease COVID-19, Disability, Education, Language, Pandemic, Research, SARS-CoV-2, Vaccine, Virus

Written by
Dr. Liji Thomas
Dr. Liji Thomas is an OB-GYN, who graduated from the Government Medical College, University of Calicut, Kerala, in 2001. Liji practiced as a full-time consultant in obstetrics/gynecology in a private hospital for a few years following her graduation. She has counseled hundreds of patients facing issues from pregnancy-related problems and infertility, and has been in charge of over 2,000 deliveries, striving always to achieve a normal delivery rather than operative.
Source: Read Full Article