New model for district-based coronavirus forecasts in Germany

Neuroinformatics scientists at Osnabrück University and data specialists at Forschungszentrum Jülich are releasing new model results daily to forecast COVID-19 infections. The predictions are based on data from the Robert Koch Institute, which are statistically analyzed using a new model weighted by probability that was developed by Osnabrück’s neuroinformatics scientists on high-performance computers at the Jülich Supercomputing Center (JSC).
The COVID-19 Bayesian Modeling for Outbreak Detection (BSTI) model has two key features that distinguish it from other models: Prof. Gordon Pipa, head of the neuroinformatics research group on the AI campus at Osnabrück University, says, “For one thing, the new method provides a forecast horizon, which allows us to assess the reliability of the predictions. In addition, the model considers the effect of infection rates in neighboring districts. This allows us to also assess the dynamics of the spread.”
One of many challenges presented by breaking down the forecasts into individual districts is the low numbers of cases. “A single forecast trajectory can be misleading, since the reliability of the prediction cannot be assessed,” explains Prof. Pipa. “That is why the BSTI model that we use calculates not just one single likely trajectory, but instead takes many possible trajectories that comply with the data into account. This enables forecast horizons to be calculated as a measure of the distribution of probabilities. This method makes it possible to evaluate the situation including statistical uncertainties, which can provide helpful information even when case numbers are low.”
Moreover, the BSTI model calculates the effect of neighboring regions. An interaction kernel describes how much a high or low case number in a neighboring region impacts the infection rate in a district. The neuroinformatics research group in Osnabrück and the Robert Koch Institute successfully used the interaction kernel in 2019 to describe the progression of infections with the rotavirus, as well as Lyme disease and campylobacter bacteria.
Experts from the Jülich Supercomputing Center (JSC) helped to adapt the method to COVID-19 data and to adjust the code for analysis on Jülich’s supercomputers. “Determining the forecast horizon is extremely compute-intensive, since we deploy many different model variations. Therefore, the statistical modeling requires much more computing time than methods that do not make use of a forecast horizon. In order to make the analyzes available on a daily basis immediately after the RKI data are released, we use resources from the Jülich Supercomputing Center—normal office computers would be completely overwhelmed by the job,” explains Jens Henrik Göbbert of the JSC.
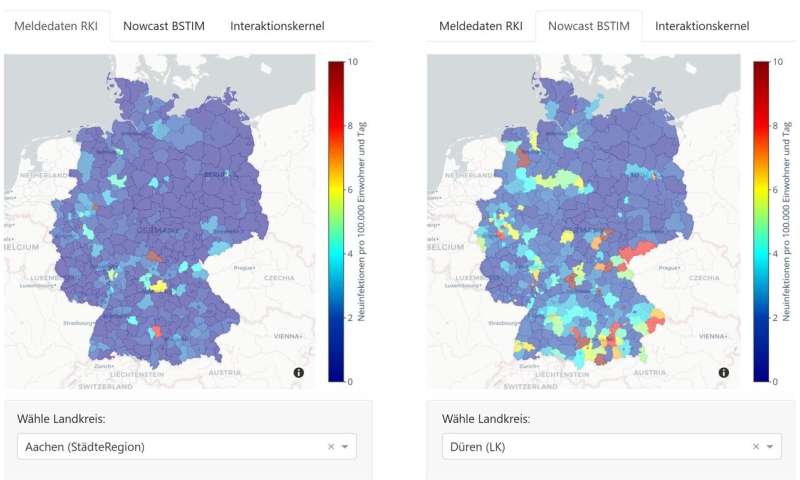
The analyzes, which are updated daily, and the option of spatial or temporal visual comparisons are free to access and shown in a format that is as comprehensible as possible. “We wanted to make the results available quickly and in an understandable format, so that a broad group of people can talk about the content straight away without getting bogged down in the technology,” explains Göbbert.
For example, visitors to the interactive site can freely select districts to view their five-day forecasts, or they can compare the latest data reported by the Robert Koch Institute with the estimated actual new infections. Because of delays in the data transfer, the reported figures often, and sometimes considerably, differ from the actual number of new cases. Therefore, the “nowcast” has the goal of providing an initial assessment of the current figures using statistical analyzes. A forecast, in turn, provides an estimate of the developments over the next five days.
Source: Read Full Article