Data on potentially preventable hospitalisations across Australia points to another Canberra bubble


Data on potentially preventable hospitalizations (PPHs) have provided fresh insights into the geographical inequities in primary care across Australia, with a view to ensuring the upcoming 10-year Primary Health Care Plan mandates proportionate funding in appropriate areas in a planned manner, according to the authors of a Perspective published online today by the Medical Journal of Australia.
In August 2019, the Minister for Health, the Honorable Greg Hunt MP, released Australia’s Long Term National Health Plan. As part of this plan, a 10-year Primary Health Care Plan is being developed. In October 2019, the Minister announced experts to provide independent advice for this purpose. This 10-year Primary Health Care Plan will set a path to guide future primary health care reform.
“This undertaking behooves laser-like focus on population-based system- level indicators,” wrote the authors, Professor Jeanette Ward, from the Nulungu Research Institute at the University of Notre Dame Australia, and Dr. Gemma Ma, from the University of Sydney.
PPHs comprise a nationally agreed set of 22 specific conditions selected through precise rationale. Hospitalization is preventable through effective community-based primary health care—where it exists. Total PPHs reflect a holistic system-level indicator calculated by combining hospital admissions for all 22 agreed conditions from routinely collected data and adjusting for age differences in populations.
“Total age-standardized PPH rate best reflects the integrated functioning of primary health care in that location,” wrote Ward and Ma.
The authors accessed 2017–2018 age-standardized total PPH rates for all 331 Statistical Areas Level 3 (SA3) . As geographical footprints, SA3s provide a regional breakdown of Australia. Each SA3 has a population between 30 000 and 130 000 people and often closely aligns with the local government area.
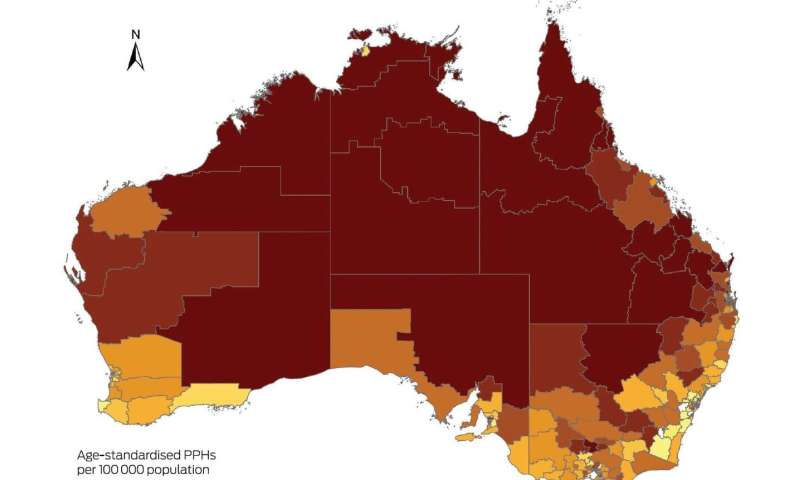
They found that total PPH rates are inequitably distributed in Australia, with the highest rates clearly visible in SA3s in remote and very remote regions.
“We note the national median PPH rate is 2742 per 100 000, but PPH rates by SA3 are highly skewed,” wrote Ward and Ma.
“The 10 SA3s demonstrating the worst PPH rates each feature rates more than double the national median. Indeed, the highest PPH rate (26 661 per 100 000 population in Barkly, Northern Territory) is more than 16 times the lowest (1662 per 100 000 population in Stonnington East, Victoria). We then ranked PPH rates by deciles, noting the first decile comprises the 10% of SA3s across Australia with the best (lowest) PPH rates, while the 10th decile comprises the 10% with the worst (highest) rates. This distribution is also inequitable, exhibiting marked variation between states and territories. Median PPH values for Queensland and the NT fall in the eighth and 10th worst deciles respectively. Given that 75% of the SA3s in the Australian Capital Territory rank in the best two deciles for SA3s nationally, bureaucrats residing in the nation’s capital may have limited awareness of the daily reality of system-level health inequity elsewhere.”
Ward and Ma wrote that their findings had profound implications for the 10-year Primary Care Health Plan.
“In the Plan, there should be arrangements for continuous public monitoring of significant quantitative improvement in total PPH rates,” they concluded.
Source: Read Full Article